GreenDroid Research Project
Contact: andrewust@cse.ust.hk
Contact: andrewust@cse.ust.hk
Researchers
Empirical study
In our GreenDroid project, we conducted a large-scale empirical study to:- understand the severity of energy problems in Android applications
- understand developers' difficulties in diagnosing energy problems
- find common causes of energy problems to enable automated diagnosis
- Xiujiang Li (MSc student from Nanjing University)
- Xiaoqian Zhu (MSc student from Nanjing University)
- Yuyao Wu (MSc student from the Hong Kong University of Science and Technology)
- Sathish Raghuraman (UG student from the Hong Kong University of Science and Technology)
1. Subject information
We investigated 173 open-source and 229 commercial applications in our study. The 229 commercial applications had energy problems (confirmed from release logs). 34 of the 173 open-souce applications have energy bug reports (see the next section). The basic information is summarized in the following table:| App Type | Availability | Min. Downloads | Max. Downloads | Avg. Downloads | Covered Categories |
| Open-source | Google code, GitHub, SourceForge, Google Play | 1K - 5K | 50M - 100M | 0.50M - 1.31M | 24 |
| Commercial | Google Play | 1K - 5K | 50M - 100M | 0.77M - 2.02M | 27 |
More subject information can be downloaded here:
- Open-source app detailes
- Commercial app details (for confidential reasons, we only release the app version and urls)
2. Problem severity
What we have found in open-source apps? (click here to get detailed information)- We found 66+ bug reports on energy problems for 34 open-source apps
- 41 bug reports have been confirmed by developers
- 30 of the 41 confirmed bugs have been fixed
- 25 confirmed bugs have a medium severity level, 7 have critical severity level
- The 34 problematic applications cover 15 different application categories
- 20 of the remaining 139 apps without energy bug report also received users complaints (if they are available on Google Play store)
- The 229 problematic applications cover 17 different application categories
- The 229 problematic applications have been downloaded more than 176 miillion times
2. Problem diagnosis difficulties
This
study is base on (1) 25 fixed open-source energy bugs, (2) 11 confirmed
but not fixed energy bugs, and (3) 1967 non-energy bugs of the
concerned open-source projects. We should be able to study 30 fixed
energy bugs, but we failed to recover the links between the bug reports
and the bug fixing patches for five energy bugs. So these five are not
included in this study. We report our findings below (click here to get detailed information)
- 24 out of 25 energy bugs are severious bugs with a severity level from medium to critical
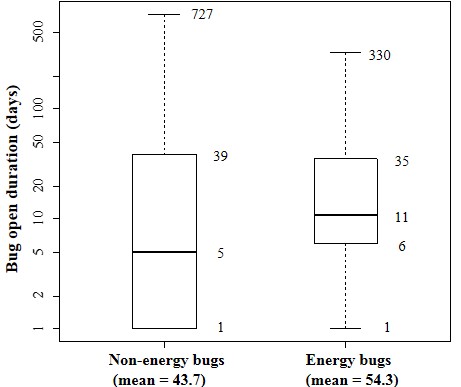
- Time to fix energy bugs: min = 1 day, median = 11 days, mean = 54 days, max = 330 days
- Time to fix each of the 1967 non-energy bugs (with similar severity level): min = 1 day, median = 5 days, mean = 43 days, max = 727 days (see a boxplot for comparison below)
- A Mann-Whitney U-test finds that fixing energy problems takes significantly longer time than fixing non-energy problems (p-value = 0.03272).
- For 25 fixed energy bugs, developers fixed 21 of them in one or two code revisions.
- For 16 out of 25 fixied energy bugs, developers modified more than 5 methods to fix them. On average, developers modified 2.6 classes and 7.8 methods to fix these 25 energy bugs.
- For 11 confirmed but not fixed energy bugs, five disappeared with code revisions, and the reason why they disappeared is unknown.
- Three of the 11 confirmed but not fixed energy bugs are still under diagnosis. Developers spend more than two years on these three bugs. They are CSipSimple issue 81, MyTracks issue 520, and K9Mail issue 3348.
- All above results suggest that energy bugs are difficult to fix. We also found some reasons why it is difficult: (1) developers need user interaction context to reproduce energy bugs, (2) developers need special debugging information to figure out the root cause of energy problems.
3. Common patterns
This study is based on (1) a manual inspection of bug reports, commit logs, fixing pathches of the 25 fixed energy bugs, and (2) an automatic permission analysis of all our studied applications. What we have found are:- The root cause of energy problems can be very application specific
- 15 of the 25 fixed energy bugs are due to the misusage of sensors and wake locks
- 46.7% (14/30) open-source applications that require GPS usage permission (i.e., the applications use GPS) have energy bugs
- 68.0% (17/25) open-source applications that require wake lock usage permission (i.e., the applications use wake locks) have energy bugs
- 51.1% (117/229) infected commercial application requires GPS or wake lock usage. The above three results (including this one) suggest that misusage of sensors and wake locks commonly causes energy bugs.
- A further study reveals two coding patterns to automate energy bug diagnosis: (1) missing sensor or wake lock deactivation, and (2) sensory data underutilization. The former pattern means that the sensors and wake locks are not deactivated properly after being activated. The latter pattern means that the sensory data are not used cost-effectively by an applications. More detailed discussion and examples can be find in our papers [1] or [2] (see GreenDroid homepage). Click here to see the real problems we have detected using these two patterns.